The Auto Trader Companion #1
What Is Up This Time?
– Tips On Using ForexGeometry Price Action Attachment Feature
– Creating Your Trading Plan Article
Updates On New ForexTrailer Edition
We have received lots of feedbacks on the current ForexTrailer and we are appreciative of the feedbacks. Now we are looking to break the limits of current ForexTrailer and put forth a New Edition of a higher capability.
The upcoming New ForexTrailer Edition will serve to be the ‘nerve’ centre to manage all your trailing needs. We are into the final phase of development and you can expect it to be out in 1-2 months time. And for our current ForexTrailer users, you won’t be left behind for you will receive an exclusive invitation when it is released. Stay tuned for our future mails.
Tips On Using ForexGeometry Price Action Attachment Feature
Now onto ForexGeometry.
Some of our Forex Geometry users have asked us the features of ForexGeometry and some examples of the uses.
We will focus on Price Action Attachment feature this time round, mainly the PA51{x} & PA52 which are the basics of Price Action Attachment.
Example of one use of PA51{x}:
For PA51{x}, where x is the number of pips when price breaks the trendline which will trigger the trade.
One use for it is when you are in a buying scenario and you need to take into consideration of the spread difference.
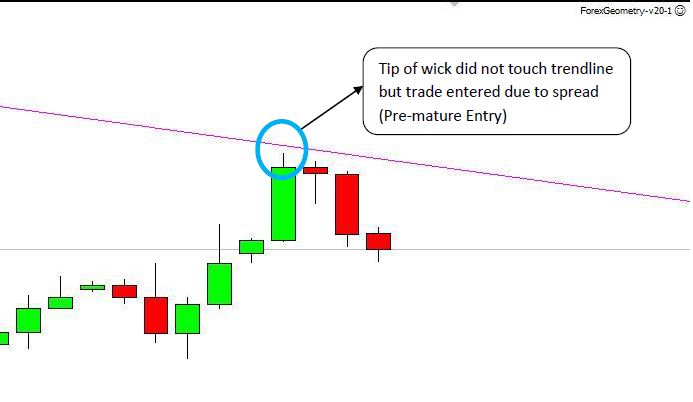
As MT4 price chart uses the BID price, any trendline break entry will be premature as you will observe that even before the price breaks the trendline, your BUY trade will trigger due to the ASK price. Therefore, you will need to use PA51{x} where x can be your spread difference in pips.

Figure 1
As you can see from fig 1 that, BUY trade will trigger due to spread which in the case is 2pips for EUR/USD even though you want to see a ‘break’ of the trendline.

Figure 2
After using the price action attachment feature which is PA51{x}, where you replaced x with 2 to be PA51{2} as in fig 2, you will be able to enter BUY trades at prices where you want a break in the trendline visually.
Example of one use of PA52:
One use for PA52 could be that you are looking at a triangle chart pattern for a breakout trade but only want confirmation when the candle closes beyond the drawn trendline to look for an entry.

Figure 3
By using PA52 in figure 3, you can trade breakout scenarios if you prefer to have a confirmation of a candle closed beyond the drawn trendline. A trade entry will then be entered automatically. This is useful for traders who want to trade chart patterns such as this triangle chart pattern where you do not know which direction the market will go to and you need further confirmation.
Note: As the above is on tips on the usage of the Price Action attachment, for more information as to how to set up PA51{x} and PA52, do refer to your video and manual guide provided.
Creating Your Trading Plan Article
http://www.fx360.com/commentary/brad/6405/creating-a-trading-plan.aspx
We wanted to share this great article link with you from fx360.com as we found this to be useful template to traders who have no clue or no trading plan to begin with. Even if you are a veteran trader, this article provides you further insights as to what you can improve on your trading plan.
Do drop us your comments below for this issue of the Auto Trade Companion to share your views and thoughts.
Your feedback is most appreciative.
We hope that you have a great week ahead and good luck trading!
For more information on ForexTrailer & ForexGeometry:
http://www.ForexTrailer.com/Special-Offer.html
http://www.ForexGeometry.com/Special-Offer.html
Regards,
Warren Seah and the ForexTrailer/Geometry Team
Copyright ©2012 ForexTrailer.com & ForexGeometry.com
NOTE: ANY INFORMATION CONTAINED IN THIS DOCUMENT IS FOR EDUCATIONAL PURPOSES ONLY AND IS NOT FINANCIAL ADVICE.
U.S. GOVERNMENT REQUIRED DISCLAIMER – COMMODITY FUTURES TRADING COMMISSION FUTURES, CURRENCY AND OPTIONS TRADING HAS LARGE POTENTIAL REWARDS, BUT ALSO LARGE POTENTIAL RISK. YOU MUST BE AWARE OF THE RISKS AND BE WILLING TO ACCEPT THEM IN ORDER TO INVEST IN THE FUTURES AND OPTIONS MARKETS. DON’T TRADE WITH MONEY YOU CAN’T AFFORD TO LOSE. THIS IS NEITHER A SOLICITATION NOR AN OFFER TO BUY/SELL FUTURES OR OPTIONS. NO REPRESENTATION IS BEING MADE THAT ANY ACCOUNT WILL OR IS LIKELY TO ACHIEVE PROFITS OR LOSSES SIMILAR TO THOSE DISCUSSED ON THIS WEB SITE. THE PAST PERFORMANCE OF ANY TRADING SYSTEM OR METHODOLOGY IS NOT NECESSARILY INDICATIVE OF FUTURE RESULTS. CFTC RULE 4.41 – HYPOTHETICAL OR SIMULATED PERFORMANCE RESULTS HAVE CERTAIN LIMITATIONS. UNLIKE AN ACTUAL PERFORMANCE RECORD, SIMULATED RESULTS DO NOT REPRESENT ACTUAL TRADING. ALSO, SINCE THE TRADES HAVE NOT BEEN EXECUTED, THE RESULTS MAY HAVE UNDER-OR-OVER COMPENSATED FOR THE IMPACT, IF ANY, OF CERTAIN MARKET FACTORS, SUCH AS LACK OF LIQUIDITY. SIMULATED TRADING PROGRAMS IN GENERAL ARE ALSO SUBJECT TO THE FACT THAT THEY ARE DESIGNED WITH THE BENEFIT OF HINDSIGHT. NO REPRESENTATION IS BEING MADE THAT ANY ACCOUNT WILL OR IS LIKELY TO ACHIEVE PROFIT OR LOSSES SIMILAR TO THOSE SHOWN.
