The Auto Trader Companion #3
What Is Up This Time?
– Tips On Using ForexGeometry Time Filter
Updates On ForexGeometry (FGS)
Recently, ForexGeometry has been updated to the latest version: v30-0. This latest version includes the feature of exiting your existing trades based on indicator chart value, just like how you can do for your entry based on indicator. You wish to have your trade exited by RSI, Stochastic, MACD or any other indicator chart based on the trendline/horizontal line. The drawn line highlights the boundary where you want your trade to exit upon breaking the drawn line by your chosen indicator.
Secondly, a Triangle Breakout System Guidebook is also released to assist you in trading triangle breakout patterns using FGS. This gives you a broader idea on how FGS can be utilize to trade different patterns and not just only the simple trendline break trade.
For all subscribers of FGS, do visit this link for more details on the latest update:
http://forexgeometry.com/20thJanUpdate2012.html
For existing customers of FGS, if you still have not updated to the latest version of FGS and obtain the Triangle Breakout System Guidebook, proceed to download at:
http://www.forexgeometry.com/MembersLogin.php
Tips On Using ForexGeometry Time Filter
One feature of the ForexGeometry is able to have an active trading time filter set up for active trading hours. If you are trading the forex market at regular hours in a preferred time period, using the time filter feature will help you plan that.
For example, if you are regularly trading only exclusive on the New York trading hours, you can set your time filter with FGS to only accept trades during this period triggered by the drawn trendlines.

Figure 1
In figure 1, you can see that there are 2 boundary lines which indicate the start and end of the active trading zone. Trades will only be entered by FGS within this active time zone, ignoring all other signals outside the active time zone.

Figure 2
In figure 2, any trades will only be triggered upon breaking the drawn trendlines by price within the active trade time zone.

Figure 3
In figure 3, you can set multiple active trade time zones for FGS across several days in advance if you regularly trade only within a certain period each day. This helps you to save time and indicate to you visually on the chart when your active trading periods are.

Figure 4
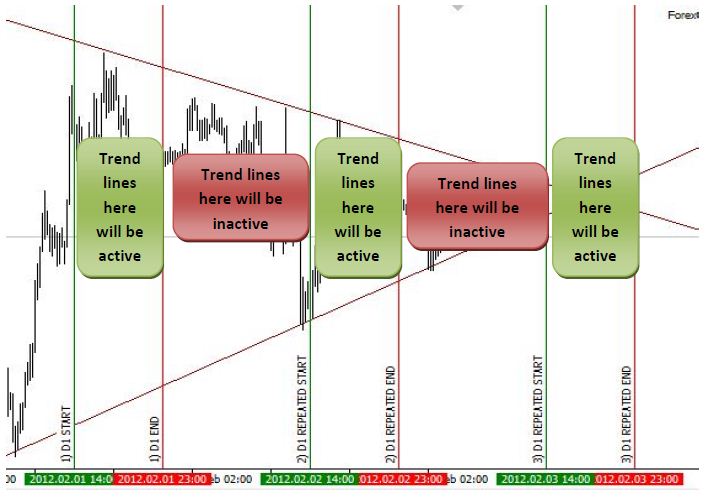
In figure 4, you can see that only trendlines/horizontal lines within the active trade time zones will be active for FGS and non-active outside of the zones. So you do not have to worry about trades triggering when price breaks your trendline outside the active trade time zone.
So by having a single active trade time zone or multiple active trade time zones, you are able to control the timing of your trade entries and work to your trading plan accordingly. This will help to work on your trade discipline and only take trades when you should only be taking without overextending yourself.
Note: As the above is on the usage of the Time Filter, for more information as to how to set up, do refer to your video and manual guide provided for existing customers.
Following The Plan Article
The previous issues I have shared with you an article link on creating a plan, this time I will follow up with sharing you an article link on the topic: Following the Plan.
http://www.fx360.com/commentary/brad/6470/following-the-plan.aspx
I think this article is great for traders of all levels and I encourage you to read up. Discipline plays a huge factor in a trader’s success, whereby it nurtures objectivity and logical decision making if a trader places discipline in following a set of written rules.
Normally I find that the articles featured on FX360 are great with lots of educational value and I will be looking for more on such great educational information elsewhere to share with you on a bi-weekly basis.
Do drop us your comments below for this issue of the Auto Trade Companion to share your views and thoughts.
Your feedback is most appreciative.
We hope that you have a great week ahead and good luck trading!
For more information on ForexTrailer & ForexGeometry:
http://www.ForexTrailer.com/Special-Offer.html
http://www.ForexGeometry.com/Special-Offer.html
Regards,
Warren Seah and the ForexTrailer/Geometry Team
Copyright ©2012 ForexTrailer.com & ForexGeometry.com
NOTE: ANY INFORMATION CONTAINED IN THIS DOCUMENT IS FOR EDUCATIONAL PURPOSES ONLY AND IS NOT FINANCIAL ADVICE.
U.S. GOVERNMENT REQUIRED DISCLAIMER – COMMODITY FUTURES TRADING COMMISSION FUTURES, CURRENCY AND OPTIONS TRADING HAS LARGE POTENTIAL REWARDS, BUT ALSO LARGE POTENTIAL RISK. YOU MUST BE AWARE OF THE RISKS AND BE WILLING TO ACCEPT THEM IN ORDER TO INVEST IN THE FUTURES AND OPTIONS MARKETS. DON’T TRADE WITH MONEY YOU CAN’T AFFORD TO LOSE. THIS IS NEITHER A SOLICITATION NOR AN OFFER TO BUY/SELL FUTURES OR OPTIONS. NO REPRESENTATION IS BEING MADE THAT ANY ACCOUNT WILL OR IS LIKELY TO ACHIEVE PROFITS OR LOSSES SIMILAR TO THOSE DISCUSSED ON THIS WEB SITE. THE PAST PERFORMANCE OF ANY TRADING SYSTEM OR METHODOLOGY IS NOT NECESSARILY INDICATIVE OF FUTURE RESULTS. CFTC RULE 4.41 – HYPOTHETICAL OR SIMULATED PERFORMANCE RESULTS HAVE CERTAIN LIMITATIONS. UNLIKE AN ACTUAL PERFORMANCE RECORD, SIMULATED RESULTS DO NOT REPRESENT ACTUAL TRADING. ALSO, SINCE THE TRADES HAVE NOT BEEN EXECUTED, THE RESULTS MAY HAVE UNDER-OR-OVER COMPENSATED FOR THE IMPACT, IF ANY, OF CERTAIN MARKET FACTORS, SUCH AS LACK OF LIQUIDITY. SIMULATED TRADING PROGRAMS IN GENERAL ARE ALSO SUBJECT TO THE FACT THAT THEY ARE DESIGNED WITH THE BENEFIT OF HINDSIGHT. NO REPRESENTATION IS BEING MADE THAT ANY ACCOUNT WILL OR IS LIKELY TO ACHIEVE PROFIT OR LOSSES SIMILAR TO THOSE SHOWN.
